
Employee engagement KPIs (Key Performance Indicators) are quantifiable measures that show how emotionally committed, motivated, and connected employees are to their work and organization. The most useful KPIs combine sentiment signals like eNPS (Employee Net Promoter Score) with behavioural signals like absenteeism and outcome signals like retention. Together they tell HR what to fix and what to scale.
Gallup's State of the Global Workplace 2026 finds only 31% of US workers are actively engaged. Gallup's ongoing Q12 meta-analysis — spanning 736 studies and 183,000+ business units — shows companies in the top engagement quartile achieve 23% higher profitability and 81% lower absenteeism. Tracking the right KPIs is what closes that gap.
This guide covers 12 employee engagement KPIs grouped into four categories, the formula behind each one, a cadence framework for measuring them, and how to build a dashboard that turns data into action.
What Is an Employee Engagement KPI?
A Key Performance Indicator (KPI) is a metric leadership commits to acting on. An employee engagement KPI is a measurement tied to a target, a cadence, and an owner who responds when the number moves in the wrong direction.
The distinction between a metric and a KPI matters in practice. Tracking eNPS is a metric. Committing to increase eNPS by 5 points each quarter, assigning the HR Business Partner to review results monthly, and triggering a listening session when the score drops below zero is a KPI. Most organizations track metrics. High-performing HR teams track KPIs.
A strong engagement KPI has five traits. It is Measurable (precise formula and a defined data source), Actionable (a low score triggers a specific response), Representative (it captures a meaningful dimension of the employee experience), Benchmarkable (industry data exists for comparison), and Communicable (readable to CHROs and frontline managers alike).

Leading vs lagging indicators
Leading indicators predict engagement before it changes. Lagging indicators confirm it after the fact. Recognition rate is a leading indicator: when recognition drops, voluntary turnover typically follows 90 to 180 days later. Voluntary turnover is a lagging indicator: by the time it spikes, the disengagement causing it happened months ago. A balanced KPI set requires both types.
The 4 Categories of Employee Engagement KPIs
Organizing KPIs into four categories makes it clear which ones to act on first and how often to check them. Flat lists of 15 to 20 KPIs spread HR bandwidth too thin to take action on any single one.
| Category | What It Measures | Example KPIs | Leading or Lagging? | Cadence |
|---|---|---|---|---|
| Sentiment | How employees feel | eNPS, ESI, Engagement Score | Leading | Monthly |
| Behavioural | What employees do | Recognition Rate, Participation Rate, Absenteeism | Mixed | Weekly to Monthly |
| Outcome | What the organization receives | Voluntary Turnover, Retention Rate, Internal Mobility, Productivity | Lagging | Quarterly |
| Wellness | How employees sustain performance | Wellness Participation, Leave-of-Absence Rate | Mixed | Quarterly |
Tracking only outcome KPIs is too late. By the time turnover or productivity numbers move, the disengagement driving them has been running for months. Best-in-class HR programs track at least two leading KPIs alongside two lagging KPIs and one wellness indicator as a minimum baseline.

12 Employee Engagement KPIs to Track in 2026
Sentiment KPIs capture the employee's internal state. They are the earliest signal that something is shifting, well before it appears in attendance records or headcount reports.
KPI 1: Employee Net Promoter Score (eNPS)

eNPS measures how likely employees are to recommend the organization as a place to work. It compresses complex sentiment into one actionable number and is the most widely cited engagement KPI in people analytics. Employees answer: "On a scale of 0 to 10, how likely are you to recommend this company as a great place to work?" Those scoring 9 to 10 are Promoters, 7 to 8 are Passives, and 0 to 6 are Detractors.
Benchmark: The average eNPS across organizations is +14. A score above +50 is considered excellent. Scores below 0 mean Detractors outnumber Promoters and require immediate action (AIHR).
Action takeaway: If eNPS drops more than 5 points quarter over quarter, segment by department to locate where the decline originates before drawing company-wide conclusions.
eNPS works only when respondents trust the channel. Anonymous pulse surveys consistently return higher and more accurate scores because employees do not fear retaliation. Vantage Pulse runs eNPS as a single-question monthly cadence with anonymous response collection by default, which removes the fear factor that suppresses honest scores in open survey formats.
For a deeper look at how eNPS is scored and benchmarked, read our guide to the Employee Net Promoter Score.
KPI 2: Employee Satisfaction Index (ESI)
ESI measures overall satisfaction through three standardized questions: how satisfied employees are with their workplace, how well the workplace meets their expectations, and how close the workplace is to their ideal job. Each question is rated on a 1 to 10 scale. The three scores are aggregated into a single index.
Benchmark: Industry average ESI sits between 70 and 79 on a 100-point scale. Scores below 60 indicate meaningful dissatisfaction and should trigger a targeted investigation into the specific dimensions pulling the index down (Gallup 2026).
Action takeaway: Pair ESI with open-text questions to understand which workplace factors are driving the score. The number alone does not tell HR what to fix.
Learn more about how to use employee satisfaction data alongside ESI.
KPI 3: Employee Engagement Score (Composite)
A composite engagement score aggregates responses to 5 to 10 pulse questions covering themes like manager relationship, clarity of purpose, recognition, growth opportunities, and psychological safety. It is the broadest of the three sentiment KPIs and the one most useful for tracking overall engagement direction over time.
Benchmark: Gallup's State of the Global Workplace 2026 reports that 31% of US employees are actively engaged. Top-quartile companies report composite engagement scores of 70% or above.
Action takeaway: A composite engagement score loses meaning without the reasoning behind it. Pair the trend line with a word cloud of open-text responses to surface the language driving the number, not just the number itself.
Behavioural KPIs track what employees actually do. They bridge the gap between how employees feel and what those feelings produce in terms of organizational outcomes.
KPI 4: Recognition Rate
Recognition rate measures what percentage of employees gave or received meaningful recognition within a given period. It is the leading indicator with the most direct line to nearly every downstream engagement KPI. Employees who receive high-quality recognition are 65% less likely to be actively looking for another job (Gallup/Workhuman 2024).
Benchmark: Gallup and Workhuman's recognition research finds that employees who strongly agree they receive the right amount of recognition are 4x as likely to be engaged at work. Recognition frequency matters: the research recommends at least one meaningful recognition per employee per month as the minimum threshold for sustained engagement.
Action takeaway: If recognition coverage falls below 50%, identify which teams and managers are not participating and set a 90-day improvement target before reviewing again.
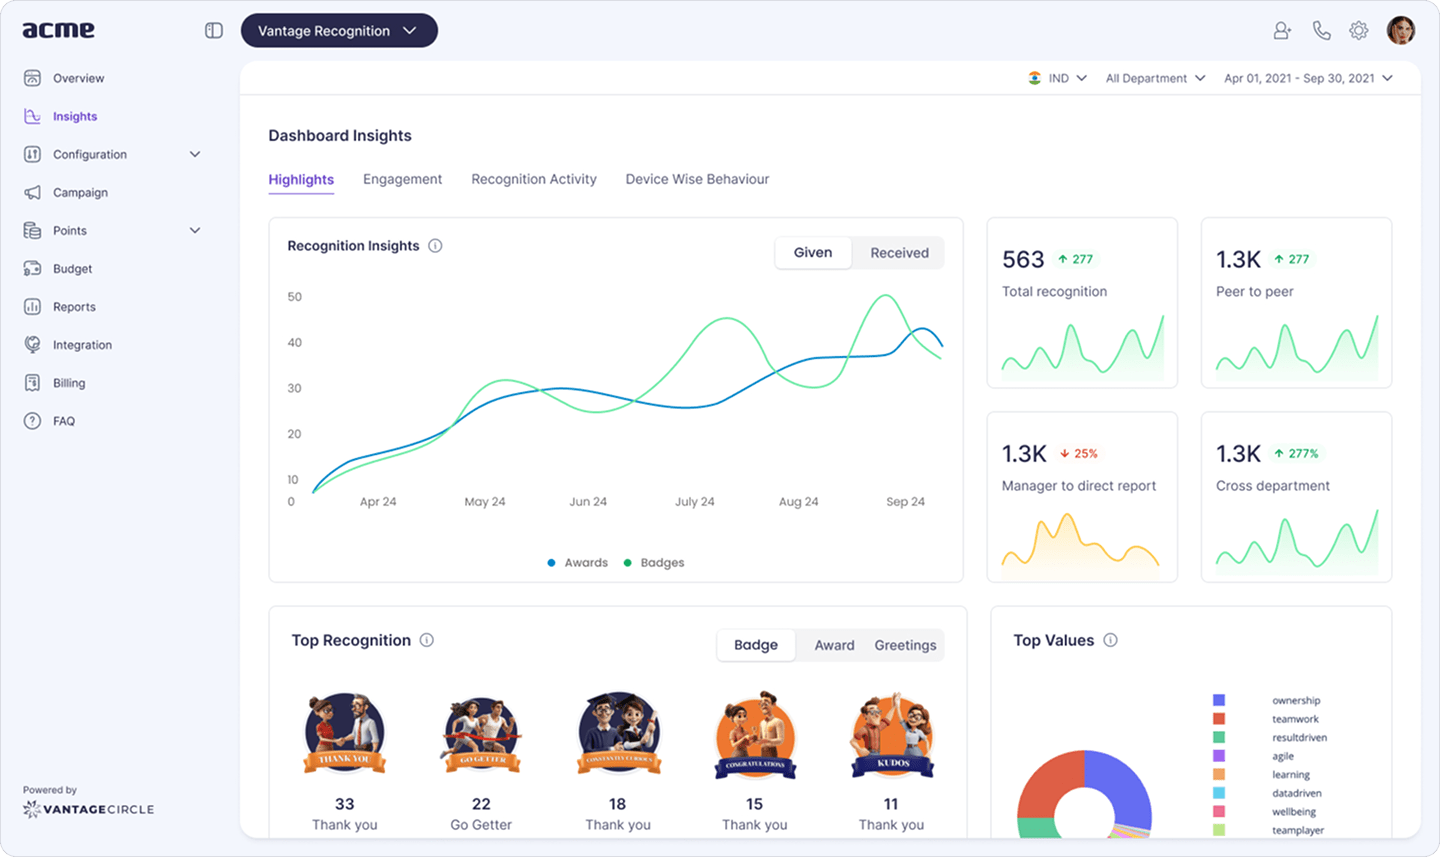
Recognition analytics dashboards track coverage by team, tenure, and location so HR can see exactly which groups are being left out and where to focus manager coaching. Vantage Rewards ships recognition analytics showing coverage, frequency, and eNPS correlation in a single view, so HR does not need to build the correlation manually in a spreadsheet.
For the full case for recognition as an engagement driver, see our guide to building an employee recognition program.
KPI 5: Survey Participation Rate

Participation rate tracks what percentage of invited employees complete engagement surveys. A low participation rate does not just reduce data volume. It invalidates the data collected, because the employees who opted out are statistically more likely to be disengaged than those who responded.
Benchmark: A participation rate of 70% or above is healthy. Rates below 50% signal survey fatigue or a lack of employee trust in the confidentiality of responses (SHRM).
Action takeaway: If participation drops below 60%, shorten the survey to five questions maximum and communicate clearly, with evidence, that responses are anonymous before the next survey cycle opens.
Vantage Pulse collects responses anonymously by default and displays anonymity status visibly to employees before they begin, which directly addresses the trust barrier that suppresses participation rates.
KPI 6: Absenteeism Rate

Absenteeism is one of the most reliable behavioural signals of disengagement. Employees who do not want to be at work find reasons not to be there. The impact extends beyond the individual: when one team member is absent, the rest absorb the workload, which degrades engagement for the entire team.
Benchmark: The US Bureau of Labor Statistics reports an average absenteeism rate of 3.2% across industries. Rates above 5% are a red flag that warrants HR investigation.
Action takeaway: Segment absenteeism by department before drawing conclusions. A company-wide rate of 3.2% can mask one team running at 7%, which is a management issue disguised as a workforce issue.
For a deeper look at causes and interventions, read our guide to managing absenteeism in the workplace.
Outcome KPIs measure what the organization receives as a result of its engagement levels. They are lagging indicators, meaning they confirm events set in motion months earlier. They are still essential because they connect engagement to business results in terms the C-suite understands.
KPI 7: Voluntary Turnover Rate

Voluntary turnover measures how many employees chose to leave the organization in a given period. It is the most financially legible signal of disengagement: each departure carries a replacement cost estimated at 50% to 200% of the departing employee's annual salary (SHRM).
Benchmark: The US annual voluntary turnover rate averaged approximately 13% across industries in 2025 (Mercer 2025 US Turnover Survey). Industry benchmarks vary; tech and retail typically run higher than healthcare or government.
Action takeaway: If voluntary turnover exceeds your industry benchmark for two consecutive quarters, run exit survey analysis to identify the most common stated reasons before designing an intervention.
See our guide to building effective employee retention strategies when turnover trends upward.
KPI 8: Employee Retention Rate
Retention rate is the metric most CHROs present to the board. It measures how many employees stayed through a given period and is the direct inverse of turnover rate. Tracking both gives a complete picture because turnover and retention are not always mirror images: new hire turnover can spike while overall retention appears stable.
Benchmark: A retention rate of 90% or above annually is considered best-in-class across most industries (SHRM 2025 Benchmarking).
Action takeaway: Pair retention rate with cohort analysis to see whether new hires (0 to 12 months), mid-tenure employees (2 to 5 years), or senior employees are the primary driver of any retention decline.
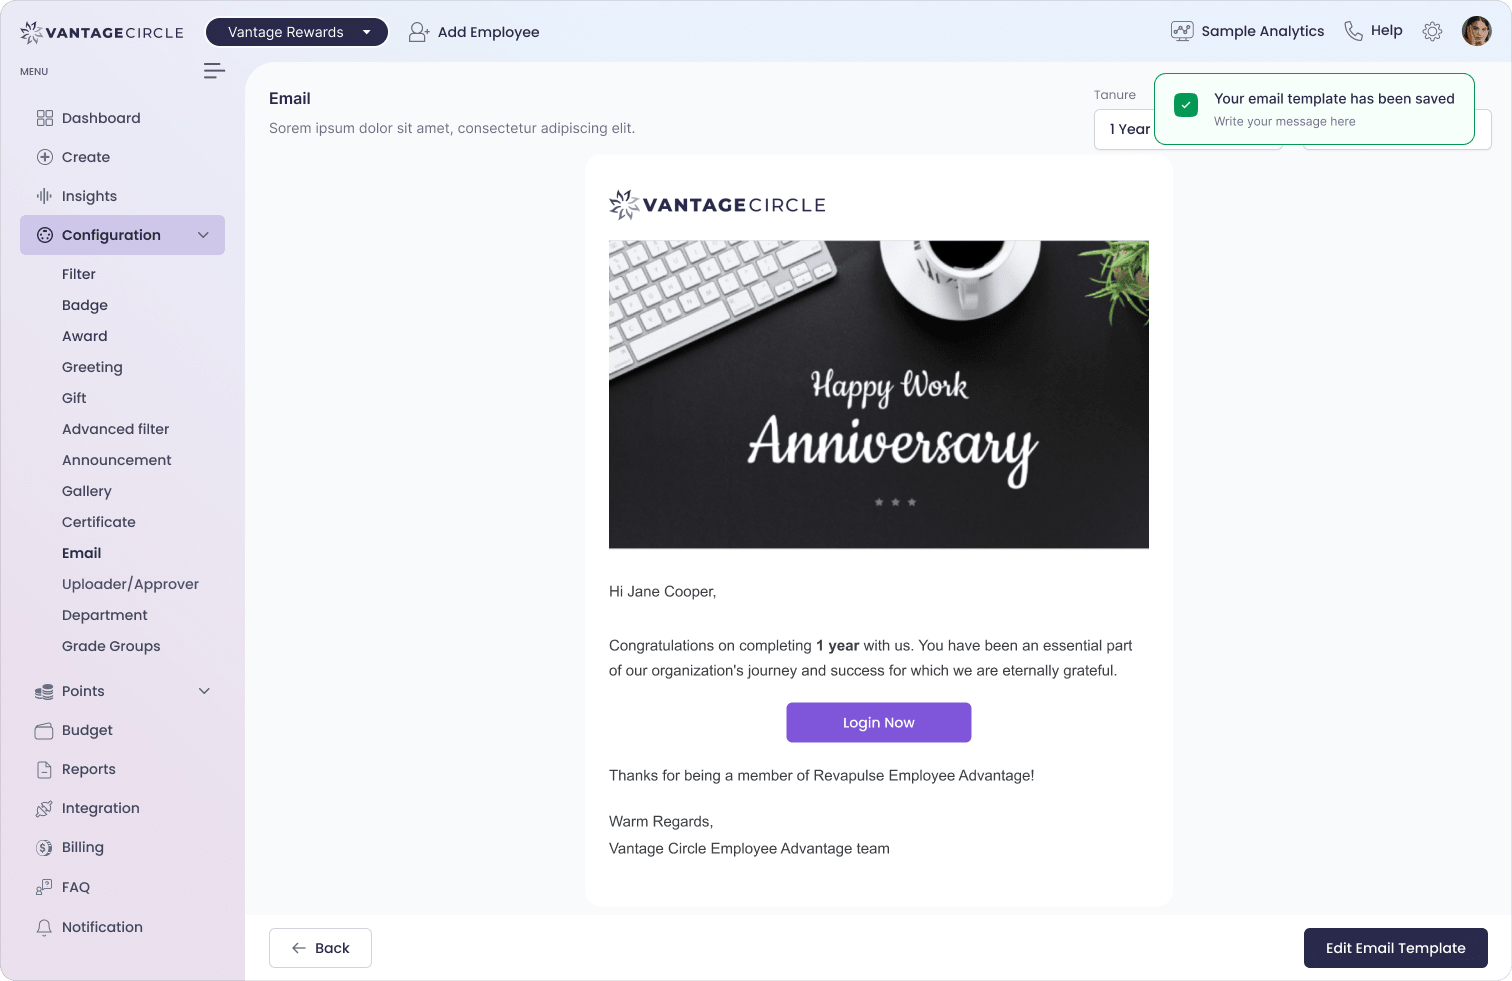
Long service award programmes are one of the most consistent levers for improving retention in the 3 to 10 year tenure band. Vantage Rewards automates milestone recognition so no service anniversary goes unacknowledged.
KPI 9: Internal Mobility Rate

Internal mobility rate tracks what percentage of open roles were filled by existing employees through promotion or lateral transfer. High internal mobility signals that employees see a future at the organization, which is one of the strongest predictors of sustained long-term engagement.
Benchmark: LinkedIn's 2025 Workplace Learning Report shows internal mobility has grown 30% since 2021 as organizations prioritize career growth over external hiring. Companies where internal mobility stalls below 10% face both talent pipeline risk and engagement erosion among high performers who stop seeing advancement options.
Action takeaway: If internal mobility is below 15%, audit whether open roles are being posted internally before going external. The fix is often process, not talent.
KPI 10: Employee Productivity Rate

Productivity rate connects engagement directly to business output. Gallup's Q12 meta-analysis finds companies in the top engagement quartile post 18% higher productivity than those with disengaged workforces. For non-revenue functions, a role-specific output metric per Full-Time Equivalent (FTE) is more meaningful than revenue per headcount.
Benchmark: Revenue per FTE varies significantly by industry. Track this KPI as a directional trend over time rather than comparing across sectors.
Action takeaway: Correlate quarterly productivity rate movement with eNPS scores from the prior quarter to validate that sentiment leads output in your specific organization before making the business case for engagement investment.
For more on building a culture that drives output, read our guide on employee productivity.
Wellness KPIs track whether employees are physically and mentally able to bring their full capacity to work. These are not secondary metrics. Unmanaged wellness risk consistently precedes absenteeism spikes and voluntary turnover by one to two quarters.
KPI 11: Wellness Program Participation Rate
Wellness participation rate measures whether employees are actually using the wellness benefits the organization provides. An unused wellness program is not a wellness program; it is a budget line with no return. Participation rate is the KPI that reveals whether the program design matches what employees actually want.
Benchmark: Average wellness participation sits between 40% and 60% across industries. Best-in-class organizations reach 70% or above (SHRM 2025 Benchmarking).
Action takeaway: If participation is below 40%, survey employees on what type of wellness support they actually want before renewing the program. Low participation is a product-market fit problem, not a communication problem.
Vantage Fit tracks daily active participation across steps, fitness challenges, meditation, and nutrition modules, showing HR which activities employees actually use versus which ones exist only in the benefits brochure.
KPI 12: Leave-of-Absence Rate

Leave-of-absence rate measures the percentage of employees on extended leave at a given point in time. Unlike absenteeism (which captures short, unplanned absences), leave-of-absence captures longer-term health, mental health, and family leave trends. A rising rate often signals burnout or chronic stress in specific teams rather than across the whole organization.
Benchmark: This rate is highly industry-dependent. Track it quarter over quarter against your own baseline rather than against a fixed external target, and always segment by department, tenure band, and manager.
Action takeaway: Pair leave-of-absence trends with absenteeism rate and eNPS by department. The combination typically points to specific managers or teams where leadership intervention is needed.

Why 12 KPIs instead of 19: Tracking too many KPIs spreads HR bandwidth thin and produces reports that no one acts on. Best-in-class HR teams report on 8 to 12 metrics tied to clear action thresholds. The 12 above cover all four categories every modern engagement dashboard needs: Sentiment, Behavioural, Outcome, and Wellness.
How to Build an Employee Engagement KPI Dashboard
A dashboard's purpose is not to display data. It is to tell HR and managers exactly what to do next. Most engagement dashboards fail because they show everything to everyone. A useful dashboard segments by audience and assigns ownership to each tile.
5 essential dashboard tiles:
| Tile | Cadence | Owner | Action Trigger |
|---|---|---|---|
| eNPS trend (monthly line chart) | Monthly | HR Business Partner | Drop of 5+ points triggers a department-level investigation |
| Survey Participation Rate | Per survey cycle | HR Operations | Below 65% triggers a survey redesign or cadence change |
| Recognition Rate by department | Weekly | People Manager | Below 50% coverage triggers a manager coaching conversation |
| Voluntary Turnover Rate (rolling 12-month) | Quarterly | CHRO | Above industry benchmark triggers exit analysis and a retention review |
| Wellness Participation Rate | Quarterly | HR Operations | Below 40% triggers a program feedback survey |
Who sees what:
The CHRO view shows organizational-level trends and quarter-over-quarter movement. People managers see their own team's scores compared to the company average. Employees see aggregate results after each survey cycle, along with the specific actions HR has committed to based on the data.
Vantage Pulse includes departmental segmentation out of the box, so HR can spot which team is pulling the company average down before the voluntary turnover data confirms what was already true six months earlier. See our guide on pulse survey questions for help designing surveys that generate dashboard-ready data.
How Often Should You Measure Employee Engagement KPIs?
Cadence is one of the most overlooked decisions in KPI design. Measuring everything annually means acting on data that is 11 months old. Measuring everything weekly creates survey fatigue and erodes the participation rates that make the data valid in the first place.
The answer is to match cadence to KPI category.
| Cadence | KPI Types | Recommended Tool | Rationale |
|---|---|---|---|
| Weekly | Recognition Rate, Survey Participation Rate | Recognition platform, HRIS | Behavioural KPIs change fast; weekly data lets managers act before issues compound |
| Monthly | eNPS, Composite Engagement Score, Absenteeism Rate | Pulse survey platform | Sentiment shifts over weeks; monthly tracking catches trends before they become crises |
| Quarterly | Voluntary Turnover, Retention Rate, Internal Mobility, Wellness Participation | Human Resource Information System (HRIS), wellness platform | Outcome and wellness KPIs move slowly; quarterly review aligns with business planning |
| Annually | ESI, Leave-of-Absence Rate (full review), Productivity Rate (annual benchmark) | Full engagement survey, HRIS | Deep-dive context that supplements the monthly pulse data |
SHRM's 2025 State of the Workplace report recommends a "pulse plus annual" model: monthly 3 to 5 question pulse surveys for real-time sentiment, paired with one annual deep-dive survey for diagnostic depth. This combination gives HR both the speed to act and the context to understand.
Common Mistakes When Tracking Engagement KPIs
| Mistake | Why It Happens | How to Avoid |
|---|---|---|
| Tracking only lagging KPIs like turnover and retention | Easier to pull from HRIS without building survey infrastructure | Add at least two leading KPIs: eNPS and recognition rate |
| Running engagement surveys annually only | Historical habit and budget constraints | Replace with a monthly pulse cadence and reserve the annual survey for diagnostic depth |
| Reporting company-wide aggregates only | Aggregated reporting is simpler to produce | Segment every KPI by department, tenure band, and manager to find the real source of movement |
| KPIs without defined action thresholds | Dashboards built for reporting rather than decisions | Assign a specific action to each KPI score band, for example: eNPS below 0 triggers a listening session within 30 days |
| Ignoring participation rate | Teams focus on the engagement score rather than its validity | Low participation invalidates the engagement score, so track participation as a KPI in its own right |
Frequently Asked Questions
What are the KPIs for employee engagement?
The 12 core KPIs span four categories: Sentiment (eNPS, ESI, Engagement Score), Behavioural (Recognition Rate, Participation Rate, Absenteeism), Outcome (Voluntary Turnover, Retention Rate, Internal Mobility, Productivity), and Wellness (Wellness Participation, Leave-of-Absence Rate). If you are starting from scratch, prioritize eNPS, voluntary turnover rate, and recognition rate — those three cover the full spectrum from early warning signal to financial outcome.
How do you calculate employee engagement KPI?
It depends on the KPI. eNPS = % Promoters minus % Detractors. Voluntary Turnover Rate = (Voluntary departures ÷ Average headcount) × 100. Participation Rate = (Responses ÷ Invitations) × 100. Pulse platforms like Vantage Pulse calculate eNPS, ESI, and composite scores automatically once survey responses are collected, removing the need for manual spreadsheets.
What is a good eNPS score?
An eNPS above +14 is industry average; above +50 is considered excellent (AIHR). Below 0 means Detractors outnumber Promoters and requires immediate investigation by department. Track eNPS as a trend over time rather than reacting to a single data point.
What are the 5 C's of employee engagement?
Care, Connect, Coach, Contribute, and Congratulate. Each maps directly to a measurable KPI: Congratulate drives recognition rate, Connect drives eNPS, and Care shows up in wellness participation and absenteeism trends. The 5 C's are a useful diagnostic frame for identifying which engagement dimension is underperforming before diving into the numbers.
How often should employee engagement KPIs be measured?
Match cadence to category. Sentiment KPIs (eNPS, engagement score): monthly. Behavioural KPIs (recognition rate, participation): weekly. Outcome KPIs (turnover, retention): quarterly. Annual deep-dive surveys provide diagnostic context that short pulse questions cannot. SHRM 2025 recommends this pulse-plus-annual model as the current best practice.
What is the difference between employee engagement metrics and KPIs?
A metric is a measurement. A KPI is a metric with a defined target, a review cadence, and a committed action when the target is missed. Turnover rate is a metric. "Below 15% annually, reviewed quarterly, with an exit analysis triggered on breach" is a KPI. The difference is accountability, not data.
Conclusion: From KPIs to Action
The 12 KPIs in this guide cover every dimension of the employee experience: how employees feel (Sentiment), what they do (Behavioural), what the organization receives (Outcome), and whether employees can sustain their effort long-term (Wellness). Grouping them into four categories makes prioritization clear. If eNPS and recognition rate are healthy, the Outcome KPIs will follow.
Measuring engagement is the straightforward part. The harder part is building the cadence and accountability loop that turns a monthly eNPS drop into a manager conversation within the same week, not a slide in a quarterly business review three months later.
Recommended Read: Employee Engagement Strategies: The Full Playbook for HR Teams

Lupamudra is a content marketing specialist at Vantage Circle, where she has written 50+ articles on employee recognition, rewards, and workplace culture, alongside employee engagement, diversity and inclusion, and HR compliance topics, including how India's tax rules apply to recognition and rewards programs.
Connect with Lupamudra on LinkedIn.