Employee sentiment is the collective emotional state of your workforce: how people feel about their work, their manager, and the organisation. Tracking it continuously and acting on what it shows is how HR teams catch disengagement before it becomes attrition.
HR has more data than ever. Turnover rates, absenteeism figures, performance scores. What those numbers don't tell you is how the person behind them is actually feeling. Sentiment fills that gap, and it shifts before the hard metrics do.
What Is Employee Sentiment?
Employee sentiment is the sum of how your people feel about their work, their colleagues, and the organisation they work for. It is not static. It shifts after a difficult appraisal conversation, a restructure announcement, a promotion someone did not get. It varies by department, by manager, by role level. Real-time sentiment tracking means catching those shifts as they happen, not waiting for an annual survey to tell you what already happened.
Three terms get used interchangeably in most HR conversations. They are not the same:
| Term | What it measures | When it applies |
|---|---|---|
| Employee sentiment | The emotional state of your workforce right now | Always on — shifts continuously |
| Employee engagement | Commitment to and investment in the job and organisation | Captured at a moment in time |
| Employee morale | Team spirit and collective mood, often tied to a specific event or period | Tied to a specific event or period |
Sentiment is the broadest of the three. An employee can score high on engagement, work hard, and meet every target while holding negative sentiment about how the organisation treated a colleague, where they see their career going, or whether leadership is being straight with them. The engagement score misses it. The sentiment score catches it.
For a deeper look at how these two concepts overlap and diverge, see our guide on employee experience vs employee engagement.
Employee sentiment is how your workforce actually feels, as opposed to how productive they appear or how committed they look on paper. It is the signal that precedes the behaviour.
Why Employee Sentiment Analysis Matters
Gallup's State of the Global Workplace 2024 report found that only 23% of employees globally felt engaged at work at its peak. That figure has since fallen to just 20% in 2025, the lowest level since 2020. The other 80% are either going through the motions or actively working against the organisation. Gallup estimates this costs the global economy approximately $10 trillion in lost productivity annually.
That gap does not show up as a single dramatic event. It shows up as flat output, missed deadlines, a sudden wave of resignations from a team that looked fine on paper. Employee sentiment analysis is how you see it forming before any of those things happen.
Retention. According to Gallup research, replacing a single employee costs between 0.5x and 2x their annual salary. US businesses lose approximately $1 trillion each year to voluntary turnover alone. More telling: 52% of exiting employees say their manager or organisation could have done something to prevent them from leaving, and 51% report that no leader spoke with them about their job satisfaction in the three months before they resigned. Sentiment data creates that conversation window before it closes permanently.
Productivity. Gallup's meta-analysis of 456 studies across 276 organisations found that business units in the top quartile for engagement show 18% higher productivity and 23% greater profitability than those in the bottom quartile. They also record 81% less absenteeism. These are not marginal differences. They are the difference between a team that delivers and one that just shows up.
Equity and inclusion. Aggregated data hides inequity. A company-wide sentiment score of 70 looks healthy until you split it by department, geography, or demographic group. Properly segmented sentiment data reveals where different groups are experiencing the organisation differently. Without that view, disparities stay invisible until they become complaints or attrition. Sentiment data is one of the most reliable ways to surface those structural factors.
Change management. Restructures, leadership transitions, and return-to-office policies all shift how people feel about work. Continuous sentiment tracking tells you which teams absorbed a change well and which are still unsettled, so you can direct communication and support where it is actually needed.
Related: Low sentiment is often the earliest sign that someone is about to leave. See how employee engagement and retention are connected.
Types of Employee Sentiment
Positive
- Trusts leadership
- Refers colleagues for roles
- High survey participation
- Strong eNPS promoter
Neutral
- Does minimum required
- Disengaging quietly
- Responds to nudges
- Passive on eNPS
Negative
- Skips surveys
- Rising absenteeism
- Disengaged in meetings
- Active attrition risk
According to Gallup's State of the Global Workplace 2024, 23% of employees globally are engaged, 62% are not engaged, and 15% are actively disengaged. Engagement and sentiment are not the same metric, but these figures reveal the scale of the problem sentiment data needs to address. The 62% in the middle is where most organisations are losing ground without realising it.
Not all negative sentiment looks the same. Not all positive sentiment means the same thing.
Positive Sentiment
Employees holding positive sentiment trust the people they work for, feel recognised for their contributions, and believe the organisation has their interests in mind. They absorb uncertainty better than most, refer colleagues for open roles, and tend to speak positively about the organisation externally. This is not loyalty purchased by pay. It is the product of consistent, fair treatment over time.
Neutral Sentiment
Neutral sentiment is the category most organisations underestimate. These employees are not unhappy enough to leave but not invested enough to contribute meaningfully. Gallup research found that at least 50% of the US workforce qualifies as "quiet quitters": people who do their job and nothing more. That is the neutral tier made measurable. A targeted nudge can shift them. A new project, direct recognition, or a development conversation often does it. Left alone for long enough, they tend to drift toward negative.
Neutral sentiment is also where disengagement quietly begins. Watch participation rates. When a previously engaged team starts returning incomplete surveys or skipping pulse check-ins, that is the signal. Our post on low employee engagement covers the early warning signs in more detail.
Negative Sentiment
Negative sentiment is not always loud. Sometimes it is a team that goes quiet in meetings. Sometimes it is a spike in short-term sick leave. Sometimes it is a department where survey participation drops to single digits while everyone assures their manager that things are fine.
A 2022 MIT Sloan Management Review study found that a toxic workplace culture is 10.4 times more predictive of attrition than compensation. Negative sentiment is the early signal of that toxicity forming. The most actionable discovery from sentiment data is often not the company-wide average but the outlier department sitting twenty points below everyone else. That is where the attrition risk lives.
How to Measure Employee Sentiment
No single tool captures the full picture. Effective sentiment measurement programmes combine quantitative methods (which give you scale and trend data) with qualitative methods that provide the context behind the numbers.
| Method | Type | Best for | Ideal frequency | Limitation |
|---|---|---|---|---|
| Pulse surveys | Quantitative | Real-time tracking, trend detection | Weekly or monthly | Low depth per question |
| Annual engagement surveys | Quantitative | Deep benchmarking, comprehensive coverage | Yearly | Data is stale by the time it is reviewed |
| eNPS | Quantitative | Loyalty and advocacy measurement | Quarterly | Single metric with no explanatory power alone |
| Open-ended survey questions | Qualitative | Context, nuance, root cause discovery | Any survey | Requires analysis time or AI processing |
| Focus groups and interviews | Qualitative | Exploratory research, testing hypotheses | Ad hoc | Not scalable; subject to social desirability bias |
| Internal social listening | Qualitative | Candid, unprompted signal from Slack, Teams, etc. | Continuous | Difficult to analyse at scale without AI |
The Employee Sentiment Score
A sentiment score quantifies where your workforce sits on a spectrum from negative to positive, typically expressed as a number between 0 and 100. Most platforms calculate it from a combination of:
- Survey response ratings across categories like wellbeing, manager relationship, and recognition
- Open-ended response sentiment (AI classifies each response as positive, neutral, or negative)
- eNPS as a cross-check on overall advocacy
No universal benchmark exists for what constitutes a "good" score. Industry, company size, and recent events all shape the baseline. What matters more than the absolute number is the trend over time and the variance between departments. A company-wide score of 72 can look healthy until you see that one department is sitting at 18.
How Often to Measure
Quarterly is the minimum for meaningful trend data. Monthly pulse surveys give faster signal without meaningful fatigue risk when kept to under five minutes. For teams going through significant change (a restructure, a leadership transition, a policy shift), monthly or fortnightly check-ins let you track the impact in near-real time. Kept short and well-timed, pulse surveys carry minimal fatigue risk.
Related: Timing affects both participation and response quality. Find out when to send your next employee survey.
Employee Sentiment Survey Questions: 15 Examples
The quality of your questions determines the quality of your data. These fifteen questions are organised by category and written to reduce social desirability bias and generate honest responses.
Engagement
- On a scale of 1 to 5, how motivated do you feel to give your best effort at work right now?
- Do you feel your contributions are recognised by your manager?
- How often do you feel proud to work for this organisation?
Wellbeing
- How well does your current workload allow you to maintain a healthy work-life balance?
- Do you feel your organisation takes employee wellbeing seriously?
- On a scale of 1 to 5, how supported do you feel when going through a difficult time at work?
Manager Relationship
- Does your manager give you feedback that helps you do your job better?
- How comfortable do you feel raising a concern directly with your manager?
- Does your manager acknowledge your achievements in a meaningful way?
Psychological Safety
- Do you feel safe sharing an unpopular opinion in a team setting?
- If you made a mistake at work, would you feel comfortable being honest about it with your team?
Recognition
- Do you feel the effort you put in is fairly recognised by the organisation?
- How often do you receive specific, meaningful recognition for your work?
Growth and Development
- Does your current role give you opportunities to learn new skills?
- Do you see a clear path for advancement at this organisation?
Run these across your main engagement categories and add two or three open-ended questions at the end. The open-ended responses are where you find out why the scores look the way they do. For a broader bank of validated questions, see our employee engagement survey questions guide.
Related: The questions you ask shape the data you get. See which pulse survey questions consistently surface honest responses.
How to Analyse Employee Sentiment Data
Collecting workforce sentiment data is straightforward. The employee sentiment analysis that turns it into decisions is where most programmes stall.
Segment before you summarise. A company-wide average almost always misleads. Healthy departments mask struggling ones. Always break the data down by department, location, tenure, and role level before drawing any conclusions.
Look for outliers, not averages. The average might be 70. The outlier is the department sitting at 22. That is where to start. Averages describe the middle. Outliers describe the risk.
Cross-reference with operational metrics. Low sentiment in a department with rising absenteeism or declining output confirms the signal. Correlation between sentiment data and hard business metrics makes the case to leadership in a language they already use.
Read the open-ended responses. Numbers tell you where the problem is. Open-ended text tells you why. AI-powered tools process hundreds of responses in seconds, classify them as positive, neutral, or negative, and surface recurring themes. What used to take an HR analyst several days now takes minutes.
Get the data to the right people. Department-level sentiment goes to the department manager. Company-level patterns go to leadership. Without this routing step, sentiment data sits in an HR dashboard and changes nothing.
Related: Sentiment data is only useful if it feeds into a broader strategy. Learn how to build a data-driven employee engagement programme.
How Vantage Pulse Does It
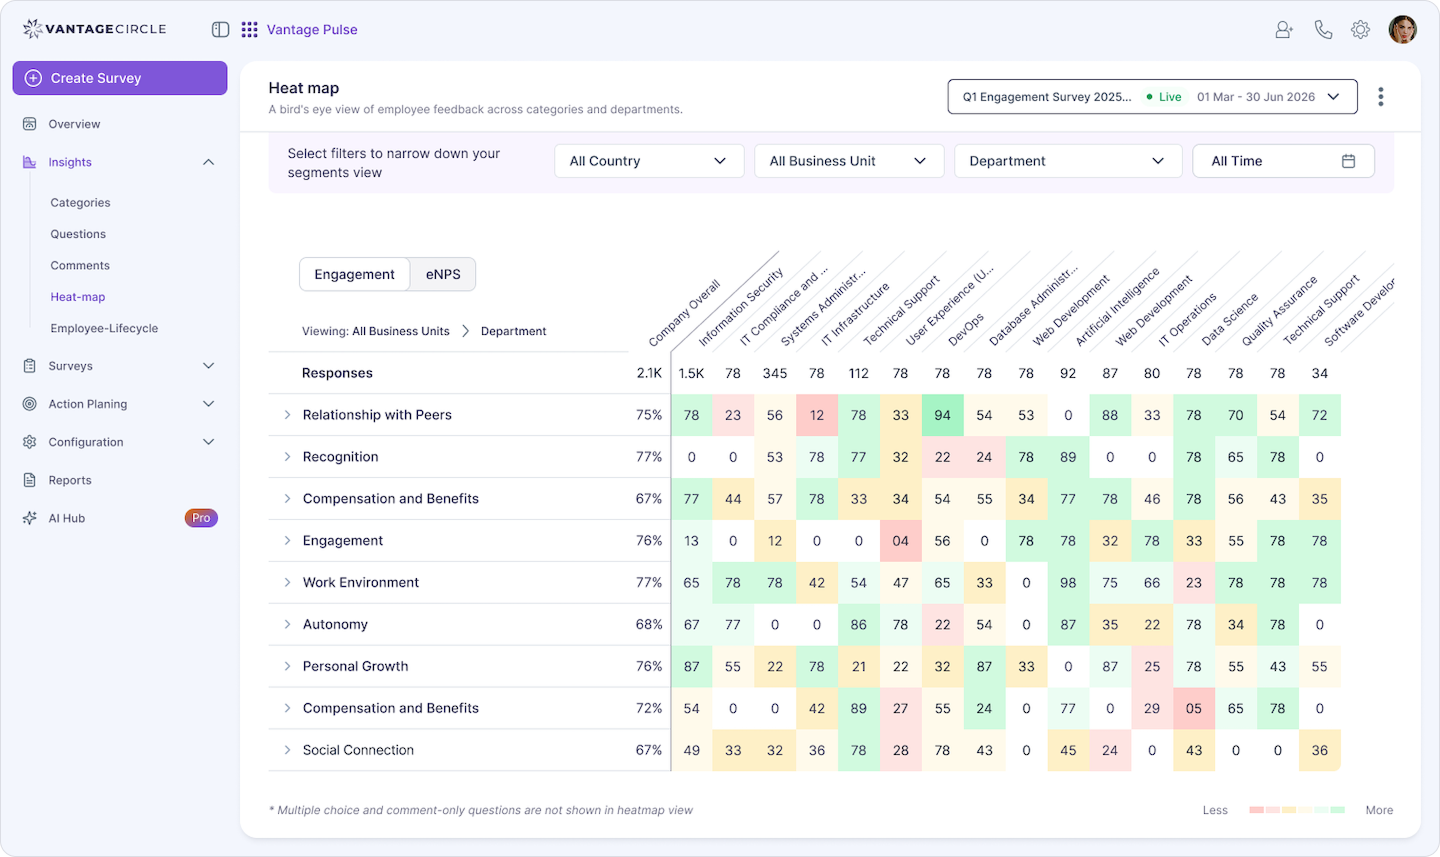
Most platforms hand you a workplace sentiment score. What HR teams actually need is to see which department is at risk, understand why, and have a structured way to respond to the individual feedback behind the numbers.
The heatmap displays every department's scores across every engagement category, colour-coded from red (critical) to green (healthy). A manager reviewing it does not need to interpret numbers. The visual is immediate. In one deployment, the heatmap surfaced a Technical Support department engagement score of 4 out of 100. That figure had been invisible in aggregate reporting.
Surfacing the score is the easy part. Who sees it, what they do with it, and whether employees ever hear back is what determines whether sentiment measurement actually changes anything.
Turning Sentiment Into Action
Measurement is the diagnostic. Knowing how to improve employee sentiment based on what the data shows is the actual job.
When sentiment is positive: Acknowledge it and understand exactly what is driving it. Is it a particular manager? The team culture? The type of work? Protect those conditions deliberately during periods of change. High sentiment is not self-sustaining. It needs to be maintained. The role of managers matters here more than most organisations realise.
When sentiment is neutral: Look at the open-ended responses. Neutral employees are often waiting for a signal that the organisation is worth committing to. A development conversation, a new responsibility, or direct and specific recognition can shift the balance. The data tells you which category is the lever for each team.
When sentiment is negative: Do not rush to reassure. Understand the root cause first. Is it a specific manager? Workload? A decision that was communicated poorly? Address the cause, not the symptom, and use follow-up pulse surveys to measure whether the change had any effect.
On communication: Whatever you find, close the loop. Tell employees what the data showed, what you are doing about it, and when they will hear back. Survey fatigue is driven almost entirely by the perception that nothing changes. Gallup's 2024 research found that 61% of employees who receive both feedback and recognition from their manager at least once a week are engaged. That is nearly three times the global average. The frequency of the response matters as much as the response itself.
Related: Sharing results badly can do more damage than not sharing them at all. Learn how to communicate survey findings without breaking employee trust.
FAQs
1. What is a good employee sentiment score?
There is no universal benchmark. Context varies by industry, company size, and what has happened in the organisation recently. What matters more than the absolute score is the trend over time and the variance between departments. A company average of 72 with one department at 14 is a more urgent situation than a company average of 60 where all departments sit between 55 and 68.
2. How does employee sentiment differ from employee engagement?
Engagement measures how invested an employee is in their work and the organisation. Sentiment measures how they feel. The two are related but not the same. An employee can be highly engaged while holding negative sentiment. They may be working hard while feeling undervalued, overlooked, or worried about where the company is going. Tracking both gives a fuller picture than either metric alone.
3. How does employee sentiment differ from employee morale?
Morale is typically situational and group-level, capturing the collective mood of a team following a win, a setback, or an organisational change. Sentiment is broader and more persistent. It captures the underlying emotional state of the workforce across time, not just the reaction to a specific event.
4. How often should you measure employee sentiment?
Quarterly is the minimum for meaningful trend data. Monthly pulse surveys give you faster signal. For teams going through significant change, monthly or fortnightly check-ins are appropriate. Annual surveys alone leave too wide a gap. Gallup research found that 51% of exiting employees report that no leader spoke with them about their job satisfaction in the three months before they resigned.
5. How do you improve negative employee sentiment?
Start with the data. Identify which departments, categories, or demographics are most affected, then read the open-ended responses to understand why. Prioritise root-cause interventions over broad-brush programmes. Then close the loop: tell employees what you found and what you are doing about it. Follow-up pulse surveys measure whether the changes worked.
6. Is employee sentiment analysis anonymous?
It should be. Anonymity is what makes the data honest. Employees who believe their responses can be traced to them self-censor, which corrupts the signal. Effective sentiment platforms anonymise responses at collection, prevent re-identification from partial data, and make the anonymity guarantee visible to employees at the point of survey completion. That anonymity guarantee is what makes the data trustworthy.

This article is written by Sahil Khan. People, culture, and what makes employees genuinely engaged, I write about it all, with practical insights HR teams can actually use.
Connect with Sahil on LinkedIn.