
A driver of employee engagement is a workplace condition that measurably raises or lowers how committed employees feel to their work. The term comes from a 2004 Institute for Employment Studies study of more than 10,000 employees, which traced engagement back to one central feeling: being valued and involved.
That study named four drivers behind it. Published lists today name five, fourteen, twenty-five, twenty-seven. The number keeps moving, and almost nobody explains why.
This matters if you are building an employee engagement program around a list you found online. You are not choosing between right and wrong answers. You are choosing between frameworks built for completely different jobs. Some came out of academic research. Some are survey item banks sold with a platform. Some are content.
The difference is not academic. Pick the wrong list and you can spend a year measuring things nobody ever showed would move engagement.
Key Insights
- The phrase "drivers of employee engagement" comes from a 2004 IES study of more than 10,000 employees, and almost no page using the phrase today says so.
- Published driver lists run from four to twenty-seven because they were built for three different jobs: research, survey design, and content.
- Even the most rigorous vendor framework is not stable. Workday retired four drivers and added three in its 2026 question library.
- Drivers are not additive. When one emotional signal weakens, it pulls the others down with it.
- Measuring a driver is a different exercise from naming one, and most programs never get to the second step.
What is a driver of employee engagement?
A driver is a condition you can change that moves engagement. A metric is how you observe the movement. An outcome is what the business gets at the end. Confusing the three is the most common mistake in this whole field.
Recognition is a driver. You can give more of it, give it faster, or spread it wider. eNPS is a metric. It tells you where you stand, but changing it is not something you can do directly. Retention is an outcome.
That distinction decides what you do on Monday morning. If your engagement score is low, the score is not the problem. Something upstream of it is. Your job is to find which condition is weak, not to set a target for the number that reports it.
Most teams skip this step. They pick a list of ten or twenty drivers, run a survey against all of them, and end up with twenty slightly-below-average scores and no idea which one to work on. Knowing your engagement metrics and knowing your drivers are two different kinds of knowing.
Where the term came from: the 2004 IES study
The phrase was coined in a 2004 report from the UK's Institute for Employment Studies. Dilys Robinson, Sarah Perryman and Sue Hayday analyzed attitude survey data from more than 10,000 employees and asked a question nobody had framed that way before: which conditions actually predict engagement?
Their answer was narrow. One thing mattered above everything else, which they called feeling valued and involved. Four contributors fed into it:
- The quality of the relationship with the immediate manager
- Communication, specifically whether employees felt informed and listened to
- Performance and appraisal, including whether the process felt fair
- Equal opportunity and fair treatment
Read that list again. It has four items, not twenty-seven. It also reads very differently from a modern vendor list. There is no mention of perks, tools, office design, or wellness programs. The researchers were not writing a wish list. They were reporting which conditions moved the dependent variable.
The sample is worth noting. The data came from an attitude survey of National Health Service employees, one large public-sector workforce rather than a cross-section of industries. The four contributors have held up well since, but the study was never a universal model and the authors did not present it as one.
You can read the original at IES Report 408. It is a 73-page PDF, which is probably why so few people have.
Why every list of drivers is a different length
Lists differ because they were built for different jobs. Research studies report what predicted engagement in a specific sample. Survey platforms publish the item bank they sell. Content teams write the list that covers the most search terms. All three get called "drivers."
Here is what the major published frameworks actually are.
| Framework | Year | Drivers named | What it was built for |
|---|---|---|---|
| IES (Robinson, Perryman & Hayday) | 2004 | 4 | A research study asking which conditions predict engagement in a 10,000-person sample |
| Gallup Q12 | 1990s | 12 | A survey instrument: items selected because they correlate with business outcomes |
| Korn Ferry | 2025 | 5 | A consultancy point of view drawn from its own workforce survey |
| Workday Peakon | 2020 | 14 | A product question library: 45 questions grouped into 14 drivers |
| Qualtrics EX25 | 2021 | 25 | A platform item bank organized under five experience KPIs |
| AIHR | Current | 27 | Practitioner education content covering the full topic surface |
Three things fall out of that table.
A twelve-item survey is not a twelve-driver model. Gallup's Q12 is an instrument. Its items were chosen because they predicted outcomes across a large database, not because somebody set out to describe engagement completely. Treating it as a taxonomy is a category error, and it is one almost everybody makes.
Long lists are usually coverage, not findings. A list of twenty-five or twenty-seven drivers is describing the surface of the topic. That has real value if you are learning the field. It is close to useless if you are deciding what to fix this quarter, because it gives you no ranking.
Even the rigorous frameworks move. In its 2026 question library refresh, Workday retired four drivers and added three: Collaboration, Communication, and Flexible Working. A framework with a validated instrument behind it changed its own count. That is worth sitting with before you treat any published list as settled.
Driver counts are not the only place this happens. Other popular models organize the same ground differently again, like the 5 C's framework, which groups engagement conditions into five themes rather than listing them individually.
The drivers that hold up
A small set of conditions keeps reappearing across the research studies and the validated instruments, whatever the count on the cover. Five groupings cover most of that overlap, and they are the ones worth your attention first.
Ben Eubanks, who researches talent practices for a living, put the weighting bluntly while describing what learning and development can and cannot move on its own.
Vantage Influencers Podcast
"We're responsible for about 5% of someone's engagement. The other 95% has to do with their manager relationship, other talent practices, how well we reward them and recognize them for their efforts."
— Ben Eubanks, Chief Research Officer, Lighthouse Research and Advisory
Listen to the EpisodeThat split is the argument of this section. The conditions below are where the 95% sits.
Engagement is also what most recognition programs say they are for. Over 80% of US companies name employee engagement as a key objective of their recognition program, according to AIRe Benchmarking Report USA 2023-24 (Vantage Circle).
Manager relationship and recognition
The relationship with the immediate manager is the most consistently replicated driver in the literature, and recognition is the part of it that organizations can actually systematize. IES put it first in 2004 and it has not moved since.
The gap is not belief. It is frequency. Fewer than 20% of US employees are recognized every quarter, according to AIRe Benchmarking Report USA 2023-24 (Vantage Circle).
Think about what that means for a driver survey. The score comes back soft, and recognition goes on the action plan. But the condition you need to change is not sentiment. It is how often recognition happens and how many people it reaches. Those are countable, and many organizations have not counted them.
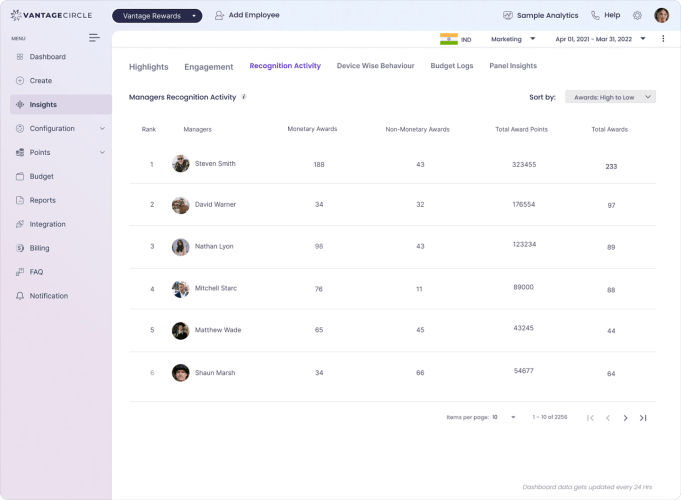
Employee recognition is also the driver that scales furthest beyond the manager. Peer recognition widens the number of people whose appreciation an employee actually receives, which matters most when a manager is spread across a large team.
Communication and employee voice
Employees need to feel informed and heard, and the second half carries more weight than the first. IES separated being told things from being listened to, and it was listening that predicted engagement.
Most organizations over-invest in the broadcast side. Newsletters, town halls, intranet posts. Those address information flow downward. The driver is bidirectional, and the upward half is where it usually breaks.
Strong workplace communication means an employee can see that something they said changed something. Not every time. But often enough that speaking up feels worth the effort.
Growth and development
Employees stay engaged when they can see a next step and believe it is reachable. The belief matters as much as the opportunity, which is what makes this driver easy to misread. An organization can run a genuinely good development program, post every open role, and still score badly here if employees do not think the path is real for them. The fix is usually visibility and manager conversation quality, not more program.
This is also the driver most likely to decay quietly. Nothing breaks. The path just stops being discussed, and the employee works out on their own that it has stalled.
Purpose and values alignment
Purpose becomes a driver when employees can connect their daily work to something the organization says it cares about. Stated values do nothing on their own. The connection has to be made visible, repeatedly, in specific moments.
Recognition is the most practical mechanism for making that connection, and organizations increasingly use it for exactly this kind of work rather than for output alone. 89% of companies now use R&R programs to reinforce behaviors and shape culture, and three in four (74%) extend this to DE&I and sustainability-related behaviors, according to The State of Recognition & Rewards 2025 (Vantage Circle).
The mechanism is simple. When a recognition names the value it reflects, an abstract statement on a wall becomes a concrete example attached to a real person and a real piece of work.
Autonomy and psychological safety
Autonomy and psychological safety work as a pair. Autonomy gives people room to decide how work gets done. Psychological safety determines whether they will use that room or play it safe.
Google's well-known 20% time is the most-cited example of structured autonomy, and the reporting on how the rule worked in practice is more instructive than the legend. The point was never the percentage. It was that the time was legitimate, so using it did not require permission.
Flexibility belongs here too. Workday adding Flexible Working as a driver in 2026 is a useful marker. How much control someone has over when and where they work now behaves like a driver rather than a benefit, which is part of why work-life balance has moved from a perks conversation to an engagement one.
Collaboration in the workplace sits in the same bracket. Modern team messaging and video platforms have taken most of the friction out of the mechanics. The harder half is norms, and norms are set by what managers tolerate.
What happens when one driver breaks down
Drivers do not behave like a scorecard where strong areas offset weak ones. Vantage Circle's own research found the opposite. One weak signal pulls the whole set down with it, which is why averaging driver scores hides the thing you most need to see.
The research tracked four emotional signals that recognition is supposed to produce. When all four hold, the effect compounds. When employees consistently feel Appreciated, Accepted, Validated, and Accomplished, motivation rises by 18 percentage points, intent to stay by 16, agility by 14, and customer excellence by 11, according to The State of Recognition & Rewards 2025 (Vantage Circle).
Then the floor gives way. When even one of the four emotional recognition signals drops, workplace sentiment slips from 98% to 83%, motivation and retention fall by over 20 points, and discretionary effort nearly halves, according to The State of Recognition & Rewards 2025 (Vantage Circle).
The four signals are Appreciated ("my work is noticed"), Accepted ("I can show up as myself"), Validated ("what I do has real meaning"), and Accomplished ("I can see the difference I make"). A program can deliver three of them and still give back a large share of the gain.
This is the part a long driver survey tends to hide. It returns one score per driver, several of them fine and one of them weak, laid out as independent lines. They are not independent. The weak one is doing more damage than its own score suggests.
It is also why the AIRe Assessment, Vantage Circle's framework for evaluating recognition program design, scores a program across Appreciation, Incentivization, Reinforcement and eMotional Connect rather than producing a single number. Four separate scores show you which signal is carrying the others and which one is about to give way.
How to measure your own engagement drivers
Measuring drivers means isolating which condition moves your engagement, in your organization, with your people. Published lists tell you where to look. They cannot tell you what is true where you work.
Start from a baseline, not a benchmark
Your first measurement is not a verdict. It is a starting point you will measure against later, which makes an honest baseline more useful than a flattering one.
Benchmarks are tempting here and mostly unhelpful, because the comparison tells you nothing about cause. The average AIRe score for US recognition programs is 60%, which shows substantial room for improvement in program design, according to AIRe Benchmarking Report USA 2023-24 (Vantage Circle). Knowing you sit above or below that figure does not tell you which part of your design is weak.
The more useful split is between programs that work and programs that do not. Fewer than 20% of US companies rate their recognition programs as highly effective. Programs rated highly effective scored 70% on design, compared with 49% for those rated low, according to AIRe Benchmarking Report USA 2023-24 (Vantage Circle). Design quality is the variable that separates them, and design quality is something you control.
Segment before you act
A company-level driver score is an average, and averages hide exactly the signal you need. Segmenting by department, tenure and manager is usually what turns a flat result into an obvious action.
For example, a communication score of 6.8 across the organization might be 8.1 in three departments and 4.2 in two. The organization-wide number suggests a communications campaign. The segmented number points at two specific teams and a much cheaper intervention.
This is a strong argument for running pulse surveys on a cadence rather than one long annual survey. Short, frequent, segmented beats long, annual, averaged, because you find the gap while you can still do something about it.
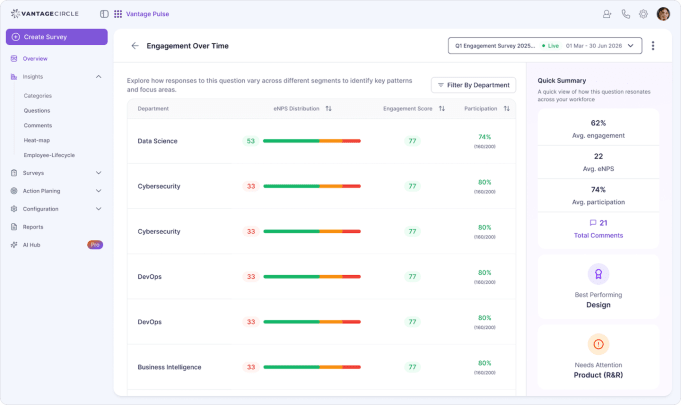
Vantage Pulse, Vantage Circle's employee engagement and pulse survey tool, is built around this pattern. Scores segment by department, and open-text responses are read for sentiment, so you get the level and the reason in the same cycle.
Close the loop on what you find
Asking about a driver and then doing nothing visible about it damages the driver you were measuring. Employee voice is the clearest case. A survey that produces no observable change teaches people that speaking up is pointless.
Closing the loop does not require solving everything. It requires telling people what you heard, what you are doing, and what you are not doing and why. The third part is the one most teams skip and the one employees find most credible.
Most organizations have already put engagement on record as the outcome they want. Companies overwhelmingly cite engagement (92%), retention (90%), and productivity (89%) as objectives of their Recognition & Rewards programs, according to The State of Recognition & Rewards 2025 (Vantage Circle).
Running employee feedback cycles without a response mechanism is worse than not running them. The measurement itself becomes a negative signal.
Where driver programs usually fail
Driver programs fail at execution more often than at diagnosis. The list is fine. The survey runs. Then the organization does not have a defined way to act on what came back, and the whole exercise becomes an annual report nobody reads.
Three failure patterns account for most of it.
No defined response to the behavior you said you wanted. 54% of US companies have no defined approach to recognizing employees who repeatedly demonstrate the right behaviors or results, according to AIRe Benchmarking Report USA 2023-24 (Vantage Circle). If someone does the right thing twice and nothing happens the second time, the first recognition is retroactively devalued.
No structured approach to sustaining attention. Over 60% of "Others" admit to having no structured approach for creating excitement around their R&R programs, whereas over 90% of "Leaders" use a mix of internal campaigns, leadership communication, storytelling, and gamification, according to The State of Recognition & Rewards 2025 (Vantage Circle). Programs do not usually die from a bad launch. They die from an unremarkable eighteenth month.
Weak program design, which then gets blamed on employee apathy. Leader programs (high-effectiveness) show an average AIRe design maturity score of 64, compared to 34 among Others; nearly four in ten Leader programs meet the modern design threshold of 70% or higher, according to The State of Recognition & Rewards 2025 (Vantage Circle). That gap is a design gap, and it is measurable before the engagement scores move.
The common thread is that none of these are driver-selection problems. You can pick a perfect set of drivers and still lose on all three. That is why a serious employee engagement strategy spends more of its planning on the operating model than on the list.
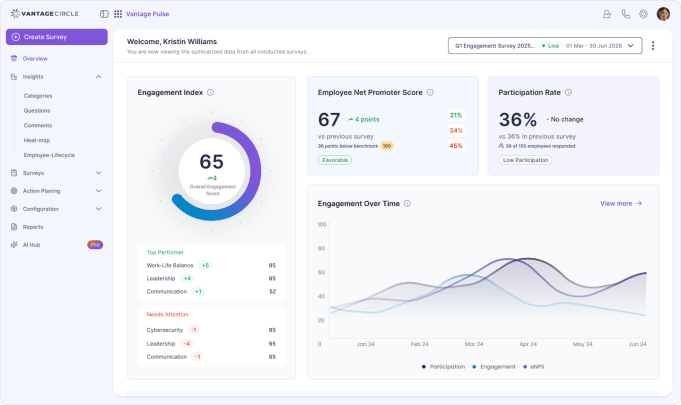
If you want to connect the two sides, Vantage Circle's employee engagement software correlates recognition activity against engagement movement over time, so you can see whether the driver you worked on actually moved.
Summing It Up
The drivers of employee engagement are better understood than the published lists suggest. Research has pointed at the same small set for twenty years: the manager relationship, being heard, a visible path forward, work connected to something that matters, and room to act. The lists get longer because they are written for different purposes, not because the evidence keeps expanding.
Two things are worth taking away. Drivers are not independent, so a weak one costs you more than its score says. And naming a driver is the easy half. Measuring it in your own organization, segmenting it, and acting visibly on what you find is the half that decides whether any of it works.
Pick a short list you can actually measure. Then go and measure it. Book a demo if you want to see what that looks like with the data in one place.
FAQs
What is a driver of employee engagement?
A driver of employee engagement is a workplace condition that measurably raises or lowers how committed employees feel to their work. Drivers are things you can change, such as recognition frequency or manager communication quality. They are different from metrics, which measure the effect, and from outcomes like retention.
What is the number one driver of employee engagement?
The relationship with the immediate manager is the most consistently replicated driver across research studies. The 2004 IES study identified feeling valued and involved as the central driver, with the manager relationship as its single largest contributor. Later instruments have reorganized the categories, but the manager has stayed at or near the top.
How many drivers of employee engagement are there?
There is no settled number. Published frameworks name anywhere from four to twenty-seven, because they were built for different purposes. Academic studies report the conditions that predicted engagement in a specific sample. Survey platforms publish the item bank they sell. Content lists aim for complete topic coverage. Shorter lists are usually more actionable.
How do you determine the key drivers of workforce engagement?
Run a survey that covers a short list of candidate drivers, then segment the results by department, tenure and manager before drawing conclusions. A company-wide average hides the variation you need. The driver worth acting on is the one with the widest spread between your strongest and weakest segments, not the one with the lowest overall score.
How do engagement drivers affect hybrid work?
Hybrid work changes how strongly some drivers operate rather than replacing them. Recognition and communication both become harder to deliver informally, so they need more deliberate structure. Flexibility itself has shifted from a benefit to a driver, which is why several major frameworks added it as a standalone item in recent revisions.

Nilotpal M Saharia is an Assistant Manager, Content Marketing at Vantage Circle and a recognition-and-rewards (R&R) strategist with 9 years of experience spanning Marketing, HR, and content strategy. He helps HR leaders turn employee recognition and leadership research into practical workplace programs.
Connect with Nilotpal on LinkedIn.